Left Toolbar > ![]() Create Nodes >
Create Nodes > ![]() Colorize Curves node
Colorize Curves node
The Colorize Curves node takes as input Curves and adds a fill color and a stroke color to them.
input
 Curve
Curve
output
 Img
Img
Image with a grow filter of 5 x 5 pixels.
On the left toolbar choose Create Nodes > Colorize Curves. ![]() >
> ![]()
Drag the Colorize Curves icon into the Node Graph.

Connect an input curve to the node.
In the drop down list select an input curve and change its fill color and stroke color and width.
Img
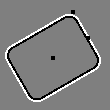
Curves.
Img
An image with the colorized curves.
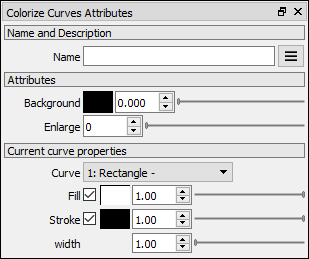
Background Color
Defines the background color.
Background Opacity
Defines the background opacity.
Enlarge
Englarges the image around the bounding box of the curves.
Curve
Defines the current curve.
Fill Defines if the curves will be filled, and the fill color and opacity.
Stroke Defines if the curves border will be drawn, and the stroke color, opacity and width.