
Pixaflux
Tutorial Tunnel Scale
The tunnel effect scale node graph project
In this tutorial you will learn how to create a Node Graph project that scales an image in multiple steps, composing each step on top of the previous one to create a tunnel like effect.

Create the Node Graph project
Create a new empty project. File > New > Empty Project
Add an image


 . Drag drop the new image, or and drag and drop new reader icon.
Add a transform node.

 .
.In Transform node expose as input the Scale attribute. Right click the Transform node and check the Scale attribute.
Create a new Attributes node.


 . Rename it as Scale, set the type number between 0.0 and 1.0 with 2 decimals. Set the scale to 0.9. This will be the default value of the attribute when this project is loaded in by a Node Graph node.
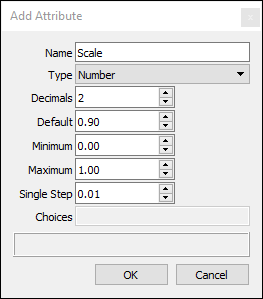
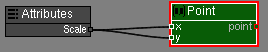
Add a Math > Point node.

 . Expose attributes x and y.
Connect Attributes> scale to x>Point and y > Point.
 The Attributes node defines 3 attributes: The size of the borders and the colors of the two borders.
 The Gradient node.
 -
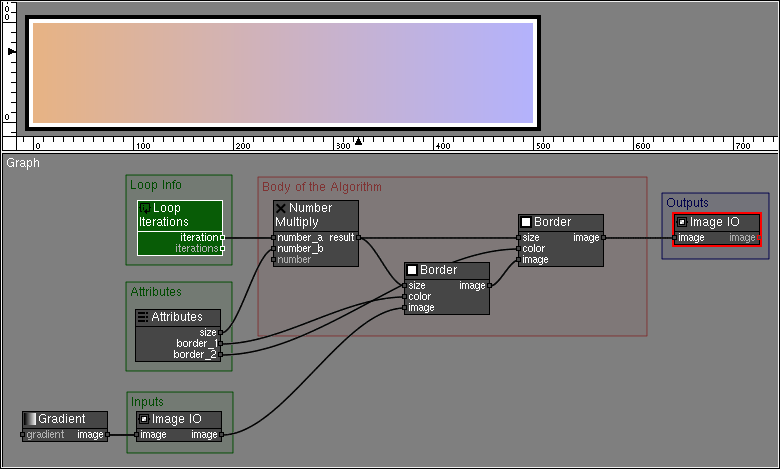
 The Image IO inside the Inputs Node Frame defines the input of the reusable node.
 - The Image IO inside the Outputs Node Frame defines the output of the reusable node.

 The nodes inside the Body of the Algorithm Node Frame define the body of the custom node: The Border nodes. Their exposed attributes are fed by the Attributes Node. Left Click on node to expose its attributes.
This project is saved in a file Double_Border.pxf.
Reusing the Double Border node graph
- Create a new empty project. File > New > Empty Project
- Create an Node Graph node
 .
. - Click the Path button and load the Double_Border.pxf project. Double click the node to reactivate it and display all its attribute, inputs and outputs.
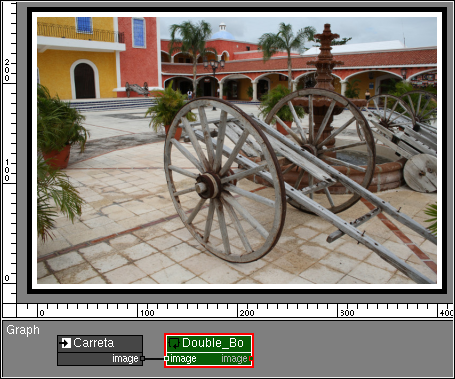
- Drag and drop an image into the project to create a Reader node.
- Connect [Reader › image] to [image › Double_Border].
- Set the size and color of the border.
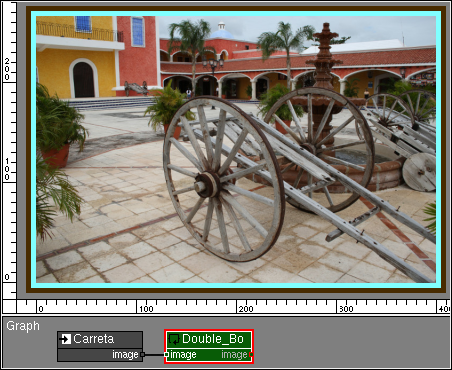
This Double_Border node applies the two borders to the image with the border size and colors defined in the attributes of the Node Graph node.
Adding More Borders
You will now modify the Double_Border.pxf project to add more borders to the image using multiple loops. Each border will be one size larger than the previous border.
- Load the Double_Border.pxf project.
- Create a new Loop Iterations node. This node has two number outputs, the current iteration and the number of iterations. The attributes of this node can be used to test the behavior of the node graph at different iterations.
- Create a new Number Multiply node.
- Connect [Loop Iterations › iteration] to [number_a › Number Multiply]. The Number Multiply node will multiply the size of the border by the current iteration.
- Connect [Number Multiply › number] to [size › Border].
- Connect [Number Multiply › number] to [size › Border].
- Resize the Node Frames and add a new Node Frame for the Loop Iterations node.
- Modify the Loop Iterations Iteration attribute to see how the border size changes on each iteration.
- Save this project as DoubleBorderLoop.pxf.
Testing the Double Border Loop Project
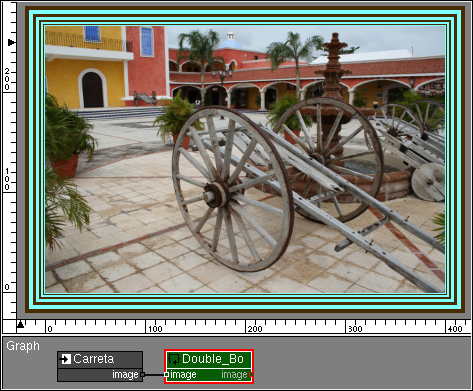
In a new project create a new Reader node with an image and a new Node Graph node. Load the DoubleBorderLoop.pxf project in this node.
Increase the number of iterations in the DoubleBorderLoop node.
There is something wrong. The DoubleBorderLoop node is not applying multiple borders, instead it is creating a larger border.
This happens because by default the Node Graph node applies the same node graph to the same input image, and each iteration makes the border larger.
To fix the effect you need to tell the Node Graph node that the new border has to be applied to image generated in the previous loop.
Fixing the Double Border Loop Project
Load the DoubleBorderLoop.pxf project.
- Activate the input Image IO node and rename it image.
- Activate the output Image IO node and rename it image.
Testing the Double Border Loop Project
In a new project create a new Reader node with an image and a new Node Graph node. Load the DoubleBorderLoop.pxf project in this node.
Increase the number of iterations in the DoubleBorderLoop node.
Creating a Custom Node from the Double Border project
Now that you have a node graph project that can be reused, you can create a new node type