
Pixaflux
Value Clamp node
Left Toolbar > ![]() Value Nodes >
Value Nodes > ![]() Value Clamp node
Value Clamp node
The Value Clamp node sets limits the values of the image between a min and max range and applies an interpolation profile to the values within the range.
input
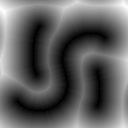 Img
VALUE image. Min: 0.0. Max 37.57.
Img
VALUE image. Min: 0.0. Max 37.57.
output
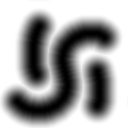 Img
VALUE image. Min: 0.0. Max 20.0.
Img
VALUE image. Min: 0.0. Max 20.0.
Procedure
To apply a Value Clamp:
On the left toolbar choose Value Nodes > Value Clamp.
 >
> 
Drag the Value Clamp icon into the Node Graph.

Adjust the attributes of the Value Clamp node.
Inputs
Img An image of VALUE color mode.
Note. If the input image is not of VALUE color mode, it is converted to value color mode using the default settings.
Outputs
Img An image of VALUE color mode.
Attributes Panel
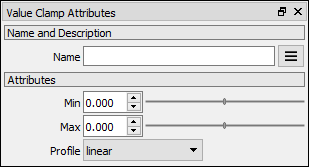
Min New minimum value of the image.
Max New maximum value of the image.
Profile Interpolation profile: linear: Linear interpolation. smooth: Smooth interpolation.. perlin: Faster smooth interpolation. arcin: Circular interpolation. arcout: Circular interpolation.