
Pixaflux
Histogram
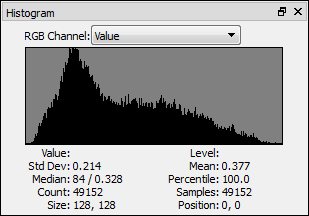
This window displays the histogram and statistics of the current Display Image.
The Histogram is a graphical representations of the distribution of data (color, alpha, intensity) in the image. When the histogram is computed it takes as input the number of levels the histogram displays, then it goes through each pixel and finds the level for the color intensity of the channels, and increases the count for those levels.
Statistics
The statistics values are shown for the focus levels, these are the levels that are selected with the mouse, or all levels if there is no selection.
Level The selected level. If a range is selected, then it shows the start and end levels of the focus zone.
Value The color intensity of the selected level. If a level range is selected, it shows the start and end color values.
Mean The mean value of the level range.
Std Dev The statistical standard deviation of the tones in the focus column.
Percentile The percentage of color intensities in the level range.
Median The statistical median of the tones in the focus columns.
Samples The total number of values taken from the image.
Count The number of tones in the level range.
Size The size of the image.
Position The position of the image.
Histogram Mouse Actions
- Click on a column to see the number of samples for that value.
- Click and drag to see the number of samples between those two selected values (start & end).
- Use the mouse wheel to zoom increase or decrease the relative size of the histograms columns (relative to the tallest column).